

Alq3 optical constants
Tris(8-hydroxyquinoline)aluminum (Alq3) at the carbon K-edge. The shipped table alq3_oc_tey holds both
\(\beta\) and \(\delta\) derived from a total-electron-yield measurement, so it lets us ask a sharper question
than a \(\beta\) fit alone:
If we fit only \(\beta\), how well does the model's analytic \(\delta\) reproduce an independent \(\delta\) table?
from lineshapes import datasets

t = datasets.load_table("alq3_oc_tey")        # energy_ev, delta, beta  (per unit density)
E, beta, delta = t["energy_ev"], t["beta"], t["delta"]
seeds = datasets.load_table("alq3_dft_clusters")
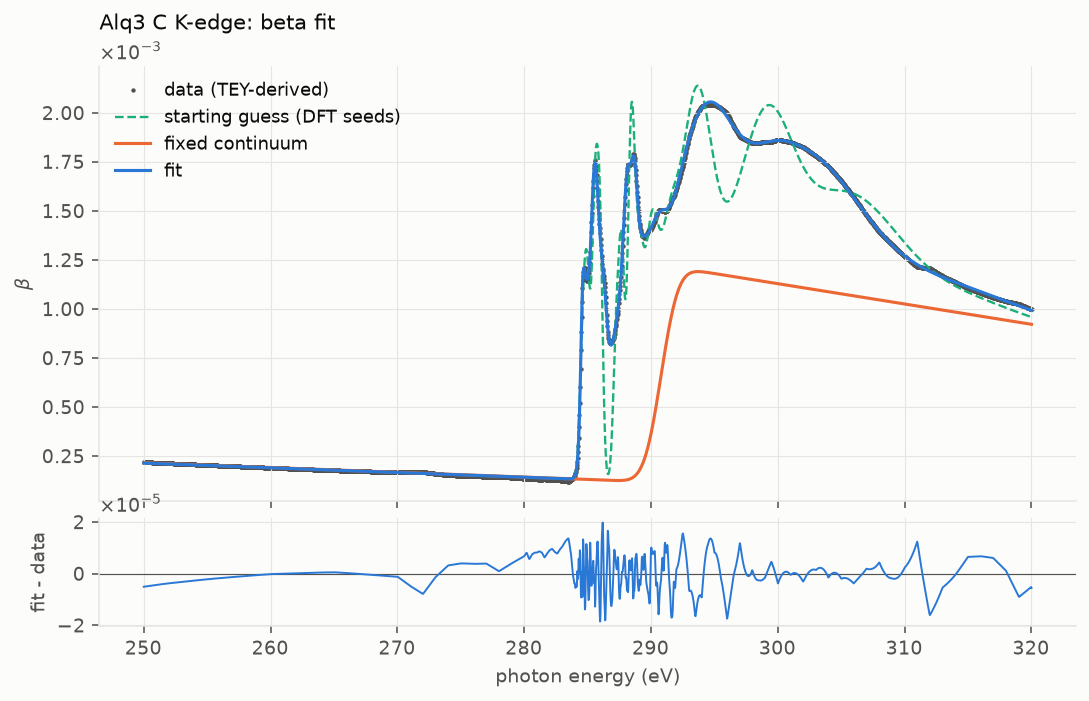
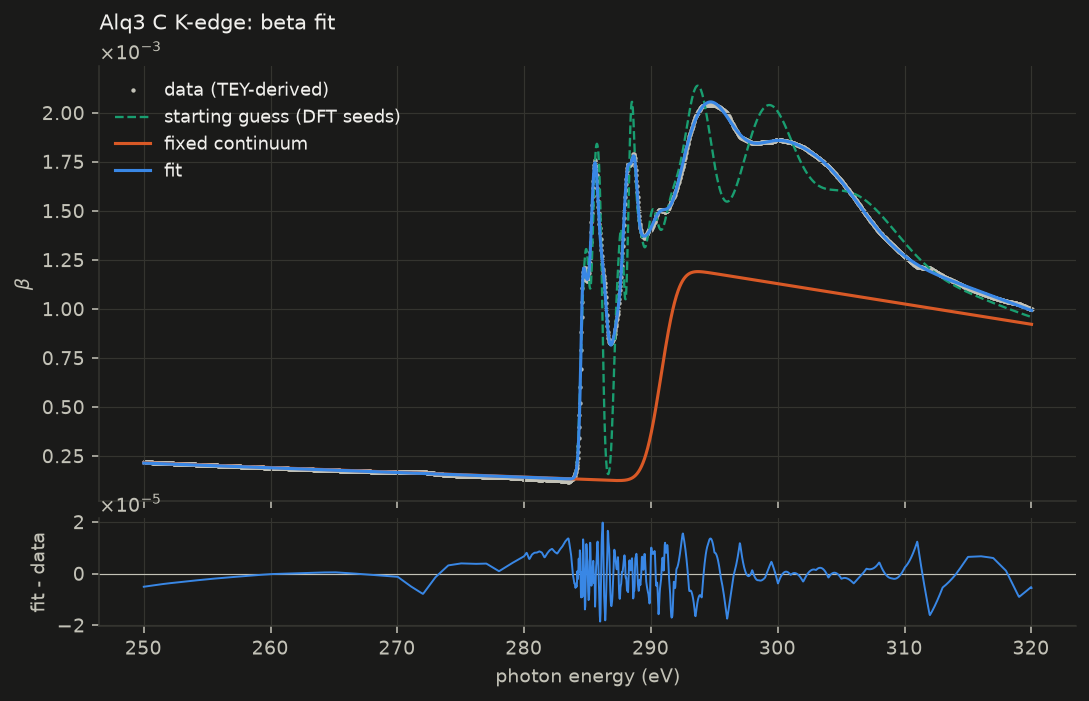
The fit is the same recipe as the ZnPc example: fixed continuum, DFT-seeded Gaussians, linear start, nonlinear refinement. Only \(\beta\) enters the fit.
Predicted \(\delta\) against the table
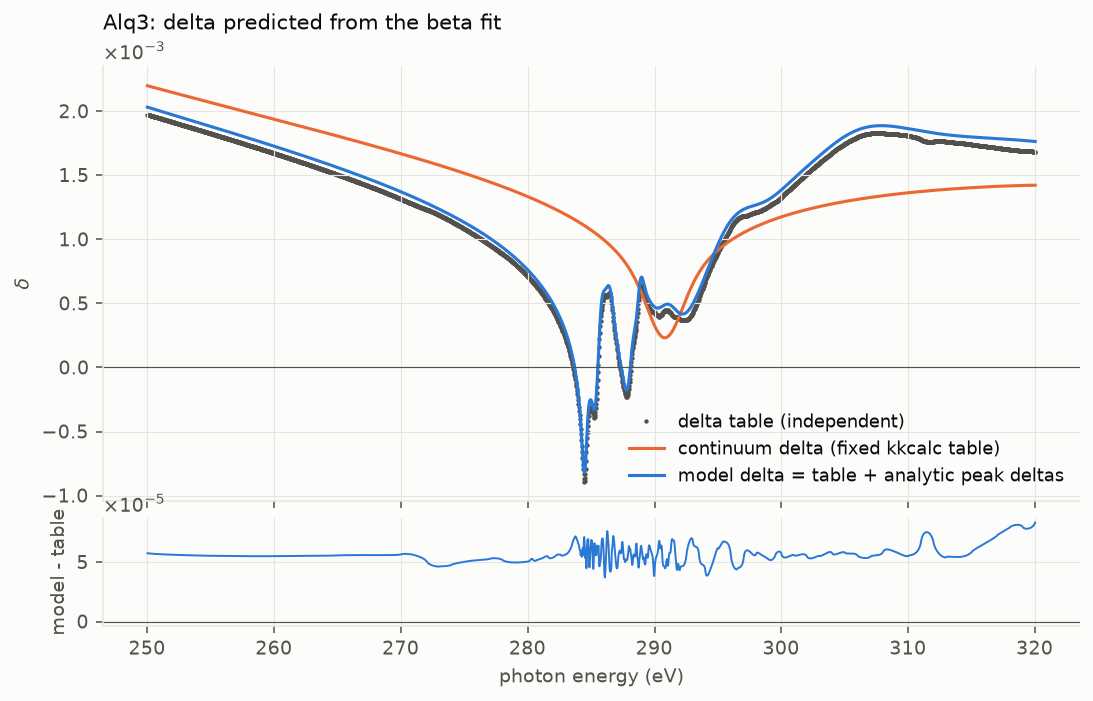
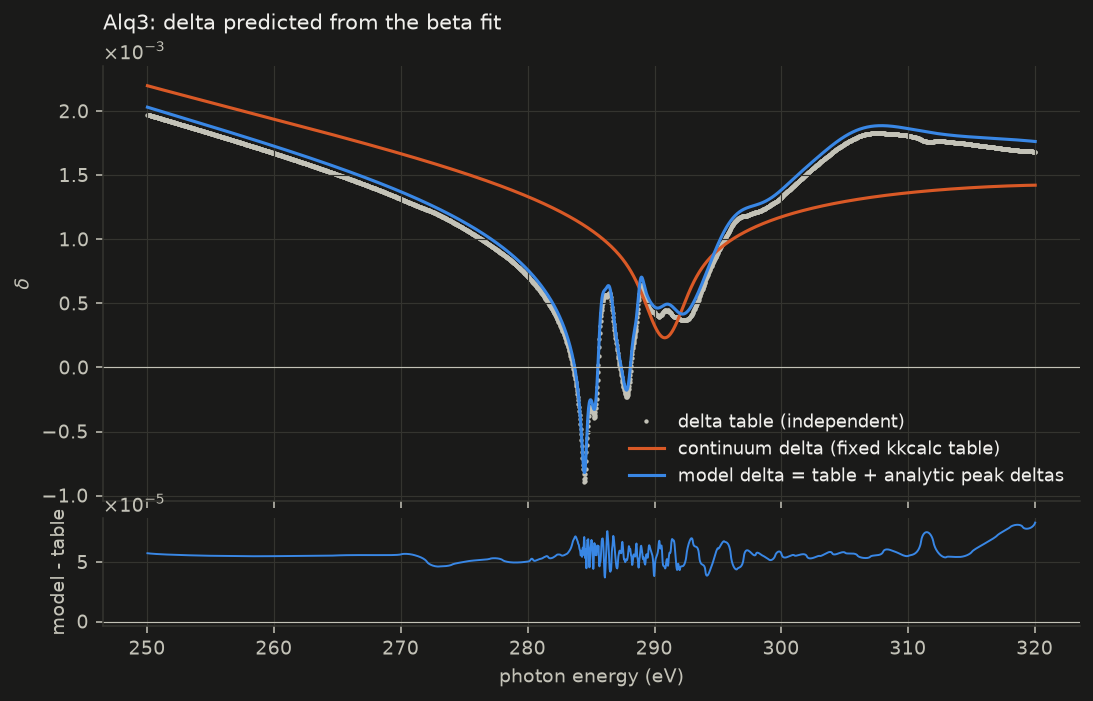
The model's \(\delta\) (continuum table plus analytic peak partners) follows every feature of the table's \(\delta\): the dispersive dips at the \(\pi^*\) resonances, the shoulder above the edge, and the long low-energy tail.
| quantity | value |
|---|---|
| beta rms residual / mean beta | 0.63% |
| fit time, 150 model evaluations | 1.06 s |
| delta rms difference vs table | 5.7e-05 (2.0% of the delta range) |
| delta max difference vs table | 8.4e-05 |
| median delta offset (model - table) | 5.6e-05 |
The difference is dominated by a nearly constant offset. That is expected: the two \(\delta\) curves rest on different continuum assumptions. The continuum \(\delta\) fixes the baseline (here the bare atom, through kkcalc2), and a constant in \(\delta\) is not constrained by \(\beta\) in a finite window. The structure in \(\delta\) (everything the peaks contribute) is reproduced by the analytic partners.
| # | E0 (eV) | 1/e half-width (eV) | height (beta) |
|---|---|---|---|
| 1 | 284.59 | 0.20 | 3.09e-04 |
| 2 | 284.80 | 0.40 | 8.50e-04 |
| 3 | 285.54 | 0.45 | 1.42e-03 |
| 4 | 286.20 | 0.42 | 5.77e-04 |
| 5 | 287.14 | 1.31 | 5.59e-04 |
| 6 | 288.13 | 0.41 | 4.73e-04 |
| 7 | 288.47 | 1.16 | 2.69e-04 |
| 8 | 288.70 | 0.30 | 3.45e-04 |
| 9 | 289.03 | 1.38 | 8.03e-04 |
| 10 | 290.50 | 1.06 | 4.77e-04 |
| 11 | 294.35 | 3.22 | 7.70e-04 |
| 12 | 299.27 | 2.55 | 1.50e-04 |
| 13 | 302.17 | 5.58 | 5.78e-04 |
| 14 | 310.19 | 11.00 | 1.74e-04 |
Fitted density scale: 0.993 (the tables are per unit density).